In a typical setup, Netflow data is constantly categorized and tracked on each router/switch interface. The web user selects one or more interfaces and can view a graph of average or/or peak traffic utilization for each category over the past hour, day, week, etc (see sample screenshots below). The user can also run ad hoc reports over any time period to explore all aspects of the traffic, such as a top talkers IP address report or a raw flow chronology.
Within an ACL, each line can pass or fail based on any combination of:
Below are several ACL examples.
simple:
ip access-list extended HTTP
 permit tcp any any eq 80 reverse
 permit tcp any any eq 443 reverse
ip host-list @local
	10.0.0.0/8
	172.16.0.0/12
	192.168.0.0/16

ip access-list extended Internet_HTTP
 deny tcp host @local host @local
 permit tcp host @local any eq 80 reverse
 permit tcp host @local any eq 443 reverse
ip host-list @SAP 10.1.2.15 10.1.3.15

ip access-list extended Columbus_SAP_on_backup_path
 permit ip any FastEthernet0/0 host @SAP reverse exporter Rtr3
ip access-list extended YouTube
 permit ip any 36561 any reverse   # YouTube is BGP ASN 36561
ip access-list extended IPT_g711
 permit udp any gt 1023 any gt 1023 dscp ef kbps range 76 84 seconds gt 1
 # g.711 should be ~80 kbps of high-port UDP for 1+ seconds
ip access-list extended EPM
 permit tcp any ge 1024 any eq 135

dynamic EPM flow %MSRPC timeout 1

ip access-list extended MS_RPC
 permit tcp any any eq 135 reverse
 permit tcp host $srcip ge 1024 host $dstip ge 1024 flow %MSRPC reverse
ip host-list @SAP_Servers 10.1.2.15 10.1.3.15
ip host-list @AD_Servers 10.1.2.5 10.1.3.5 10.1.4.5
ip host-list @Proxy_Servers 10.2.0.5 10.2.0.6 10.3.0.5 10.3.0.6

ip access-list map CategoryMap
  SAP	           @SAP_Servers
  ActiveDirectory  @AD_Servers
  Internet         @Proxy_Servers
  Voice            @Voice_Servers @Voice_Gateways
  Epic             10.3.6.0/24
Categories are grouped together to create an ordered "view" which is then applied to one or more exporting devices. Multiple views can be used on the same device (e.g., it's common to have summary and detailed views of the same data). The number of categories is unlimited, though the quantity and order of categories does impact performance.
For more info on the ACL syntax, data rendering, and other configuration options, please read the PDF documentation.

This butterfly view may seem confusing at first, but it's a very practical way to display many traffic categories in both inbound/outbound directions. Naturally, you can generate simple single-axis graphs as well, as well as export the raw graph data to csv/Excel for manual manipulation.
Data is aggregated at one-minute resolution, by default. For example, here is the previous graph zoomed in to 8:00 - 10:00 am:
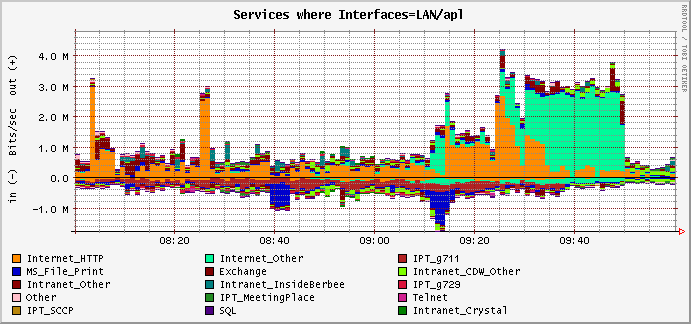
One-minute resolution is ideal for most enterprises since it closely matches the human factor of the end user's tolerance / patience. E.g., most users won't notice or be concerned by occasional short periods of slowness but, if the impact is a minute or more, it's almost guaranteed that they'll be unhappy.
The default aggregation can be lowered to one second and coupled with flexible netflow's one-second active flow timeout to produce amazingly precise graphs. However, the precision comes at a signifcant CPU/disk cost. If your goal is microburst policing, Netflow is really not the right tool for the job.
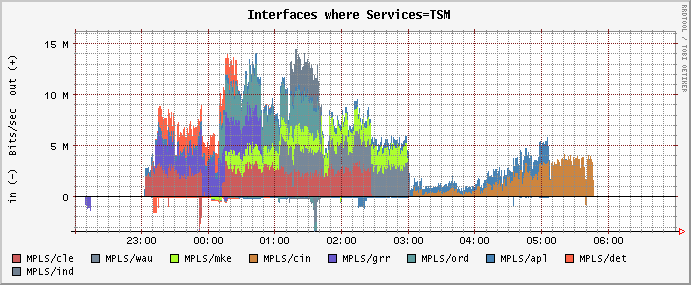
The graphs above show traffic categories for a router interface. You can also flip this around. E.g., the following graph instead has the single traffic category "TSM" (disk backup) broken out by interfaces named "MPLS/cle" (Cleveland), "MPLS/wau" (Wausau), etc.
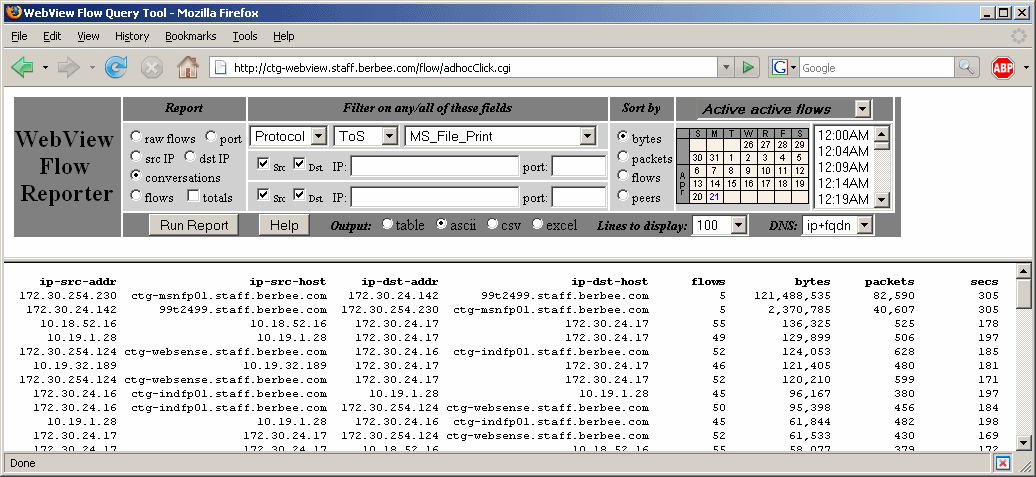
In addition to traffic volume, Webview also reports on flows, packets, and concurrently active IPs. For example, you might be interested to know what the average bandwidth need is per active user of a certain application. The following report shows that each user of "Internet_HTTP" needs about ~30 Kbps when measured over a business week (8am - 5pm, Monday - Friday):
| Maximum bps | Average bps | |||||
|---|---|---|---|---|---|---|
| Date | Interface | Category | In | Out | In | Out |
| Mon Apr 14 2008 | LAN/apl | Internet_HTTP | 27,049 | 154,515 | 3,979 | 23,660 |
| Tue Apr 15 2008 | LAN/apl | Internet_HTTP | 62,212 | 122,788 | 6,778 | 18,697 |
| Wed Apr 16 2008 | LAN/apl | Internet_HTTP | 46,705 | 235,215 | 4,974 | 24,456 |
| Thu Apr 17 2008 | LAN/apl | Internet_HTTP | 46,584 | 312,958 | 5,161 | 30,668 |
| Fri Apr 18 2008 | LAN/apl | Internet_HTTP | 23,755 | 213,472 | 4,880 | 45,318 |
The graphing engine is very flexible (possibly too flexible!):

Leads to this...
This view goes after the raw flow data, which is generally kept for at least 4-8 weeks (depending on available disk space).
The raw flow data available for reporting goes back in time as far as disk space allows. Most small to medium enterprises find that 30 GB is adequate for a month of data. Larger networks can use many terabytes.
Filtering options:
Reporting options:
Other options:
Note: The usefulness raw netflow data cannot be overstated! Many Netflow software packages aggregate the data or drop fields that don't fit their notion of monitoring. The ad hoc query tool provides a powerful interface to the raw data, the user has unlimited options for investigating this data.
Interfaces can also be aggregated and renamed. For example, say you had four routers:
Rtr1 Ethernet0/0  "Cleveland LAN"
Rtr1 Serial0/0    "Cleveland MPLS T1"

Rtr2 Gig0/0       "Columbus LAN primary"
Rtr2 Gig0/1       "Columbus LAN backup"
Rtr2 Multilink1   "Columbus MPLS 3xT1"

Rtr3 Fast0/0      "Columbus LAN"
Rtr3 Tunnel1      "Columbus MPLS VPN backup"

Rtr4 Fast0/0      "Indianapolis LAN"
Rtr4 Serial0/0.3  "Indianapolis Frame-relay T1"
'(\S+) LAN'						'LAN $1'
'(\S+) (MPLS|Frame-relay|ATM|Direct|Tunnel) (\S+)	'WAN $1'
| Alias displayed in the GUI | Interfaces used in reports |
|---|---|
| LAN Cleveland | Rtr1, Ethernet0/0 |
| LAN Columbus | Rtr2 Gig0/0 and Gig0/1 and Rtr3 Fast0/0 |
| LAN Indianapolis | Rtr4 Fast0/0 |
| WAN Cleveland | Rtr1, Serial0/0 |
| WAN Columbus | Rtr2, Multilink1 and Rtr3, Tunnel1 |
| WAN Indianapolis | Rtr4, Serial0/0.3 |
The beauty of this approach is that GUI interface is stable and easy-to-navigate, even though the underlying network routers and interfaces may change frequently. It also lets multiple interfaces be easily aggregated together.
However, for those who don't fit this mold, Webview has full support for processing and visualizing Netflow data:
The subnet tracking very useful when Netflow data is not available for a portion of the network. For example, perhaps Netflow is collected only from the head-end routers of an full-mesh MPLS WAN. In this case, tracking Netflow stats by subnet can provide an excellent inferred view of each remote site.
This last approach has several advantages:
Soapbox on why managing your flow collection is really importantHere are some real-world examples of Netflow data mismanagement:
- Network traffic spikes create congestion that causes Netflow export packets to be dropped. As a result, the network admin sees no evidence of the spikes!
- Multiple copies of each netflow packet are finding their way to the collector. This can happen when a router has multiuple exporters defined or when intermediary collectors are misconfigured (e.g., using netflow relay, forwarding, or chaining features of commercial packages).
These problems are difficult to notice without a good view of collection health. My experience is that commercial Netflow products are weak in this regard. When given out-of-order or duplicate netflow packets, they either don't notice anything is wrong, or they report erroneous findings (billions of drops, for example).

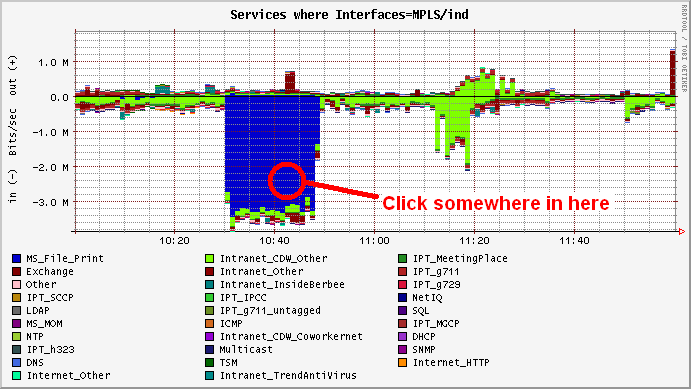
Ignore the downward spikes (these were voice probes from NetIQ) and focus on the small ~25 Kbps purple and red rectangles between 19:20 to 20:20. These show that a G.729 flow was being marked in one direction but not the other. A click on the purple untagged area reveals the faulty endpoints. A further raw flow report will show the DSCP's:
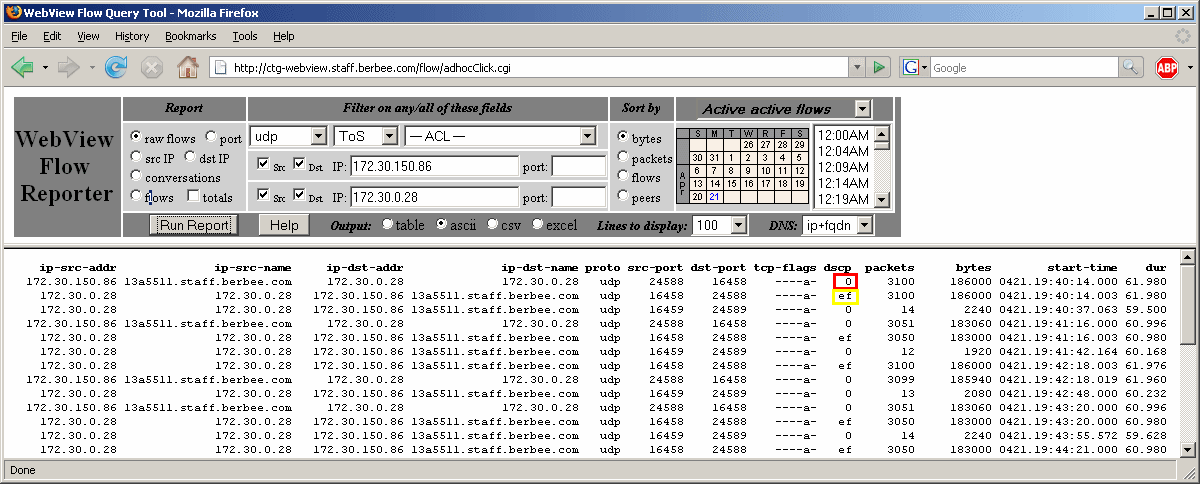
In this case, one direction of the VoIP conversation is properly marked as DSCP EF, but the other direction isn't.
Netflow reports can also shine a light on jitter/quality measurement from sources like Cisco's IP Service Level Agreement (IP SLA, formerly SAA or RTR). For example, in this QoS validation analysis, the first two graphs show round-trip time (RTT) and jitter for voice and data traffic on a given WAN link as reported by IP SLA. The third graph shows the Netflow traffic utilization. The big Netflow spikes correlate to increased jitter and RTT's on the data traffic, but the VoIP traffic remains immune. The final table shows that the traffic causing the spike is properly being marked as DSCP CS1, which is used for scavenger "less-than-best-effort" service. This analysis took about an hour to do and it proves that VoIP is not impacted by non-VoIP traffic and that network spikes are properly being marked as scavenger. Are you sure that's true in your network?
Note: the /www/ipsla directory of Webview includes an IP SLA monitoring daemon and reporter. If you don't have any other product for IP SLA (e.g., Cacti, NetIQ), then this one works pretty well.
A Webview user at an ISP penned the article Mining Netflow on this topic in Information Security, Jan 2006. He uses it daily to root out zombies and malware on his customer's machines. Talk about great ISP service!
Another Webview user had a SQL worm outbreak that evaded their antivirus systems (the worm was brand new but the attack vector was known and unpatched). They only detected the worm when their network started crashing. At that point, sniffers could only tell you who was currently infected. Luckily, Netflow forensics with Webview was able to show that the infection began over 24 hours earlier when a SQL administrator plugged in his laptop infected with W32.Toxbot.B, which then received orders from a rogue machine in the UK to unleash the worm upon the network.
Netflow forensic analysis with Webview can also reveal a lot about Internet usage behavior. ISP's have used it to answer questions from the domestic (a father wondering just what the #@$! his son was downloading) to the felonious (child enticement, kidnapping, threatening "anonymous" emails, etc). Netflow is not CALEA "compliant", but it is a cost-effective way for network operators who are under the CALEA radar to responsibly address these questions if/when they come up.
Most WAN accelerators tunnel all optimized traffic, which makes it nearly invisible to Netflow on the WAN router. However, the pre-optimized traffic is available from WAN router Netflow if WCCP is used to redirect traffic to the accelerator (example). The pre-optimized traffic may also be available as Netflow from the WAN accelerator itself.
Cisco and modern Riverbed and Expand products all support transparent acceleration which preserves the IP header of each connection (example). In these cases, Webview is able to report on both pre- and post-optimization traffic per category.
<soapbox>
It's amazing that many enterprises still use 5 or 15 minute sample
intervals and magic numbers like "60%" to manage their WAN capacity.
If you love your network users, please set all your bandwidth monitoring
tools to use one minute samples I
was working for a large retail client whose
point-of-sale app seemed to be randomly failing in the stores. The network admin insisted the WAN
links were fine. His proof was a graph of 5-minute samples that showed
an average utilization of under 25%. We turned on Netflow and, within a few minutes,
it becamd clear that the actual traffic volume was 10%, but that
a Microsoft replication job pegged the link to 100% for a couple minutes
every quarter hour. D'oh!
In the well-run enterprise, capacity planning goes far beyond a
macro-level view of traffic in/out an interface. Real capacity planning
is about understanding how individual applications behave when faced
with debilitating congestion, and that requires a micro-level view
that takes QoS policies into account. It's also about understanding
difficult-to-control sources of congestion, such as unsolicited
Internet traffic, flash crowding on full-mesh MPLS WAN's, and VoIP
return-to-service after power outages. And, most importantly, it's about
understanding human tolerance and monitoring to that level (e.g., how
long until the user clicks the refresh button, restarts their Citrix
session, or reboots their PC?).
</soapbox>
That said, Webview does a pretty OK job at capacity planning. It can track long periods of both bandwidth:

and active users:

There is also an optional module called Netusage that extracts business-day data for each element and has a simplified, "manager-friendly" web interface, complete with simple line/pie graphs and easy to read reports. It also stores its data in MySQL, making the data more accessible by tools like Excel and Access.
Webview can help empower you to strut into a migration status meeting with an armful of graphs and reports based on real-world data that show percentage complete, stragglers, etc. The project managers will be amazed and wonder how the network guy was able to get such wonderful data.
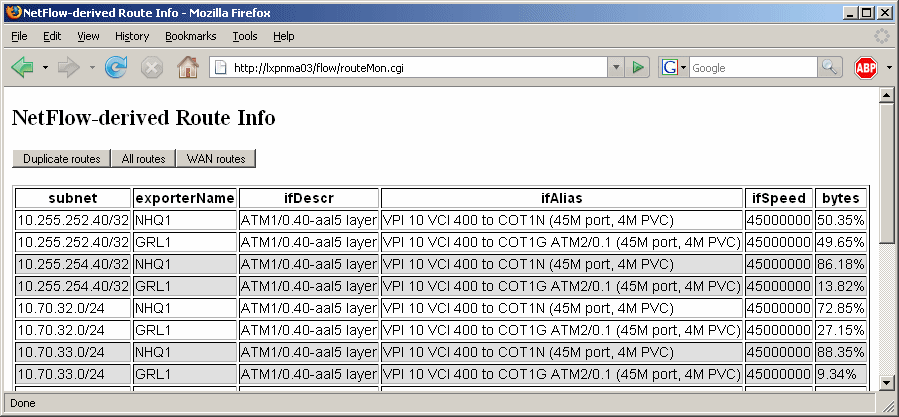
This information could be tremendously powerful and it's just waiting for the right problem to solve. But, unfortunately, the predominant network management paradigm is to ignore the routing table and instead of focus on managing elements. Thus far, this collected route data has mainly been useful for examining duplicate routes and ensuring that they are intended or not. E.g., in the below report, the duplicate routes are different paths to the same remote office.
If you will be collecting netflow on fewer than 5 routers with a total of less than 200 Mbps of traffic, then sizing should not be a concern. Go ahead and install Webview on a virtual machine with one vCPU, 512MB RAM, and 40-250GB of disk, and see how it goes.
If you will be collecting much more flow data, then you need to consider other factors: